
Climate Science - The Human Impact
Climate Science Part 2
This is the second of a series of blog posts that will give you a basic introduction to the science behind climate change, explain how humans are changing the climate and steer you towards to the latest scientific evidence. Search for the “Climate Science” category on our blog page to find the rest of the series.
Part 1 of this series explained the basic science of climate change, such as the greenhouse effect and the difference between climate and weather, it can be found here.
How are humans changing the climate?
Humans are changing the natural balance of greenhouse gases (GHGs) by emitting large volumes of CO2, mainly through the burning of fossil fuels. To a lesser extent, human activities such as agriculture and deforestation are emitting other GHGs such as methane and reducing the Earth’s resilience against the adverse effects of climate change.
The man-made element of the change is known as anthropogenic climate change. Since 1958 the atmospheric concentration of CO2 has been measured and recorded continuously at an Observatory in Hawaii, and the series of measurements are known as the Keeling curve after the scientist who set up the monitoring, Charles Keeling:
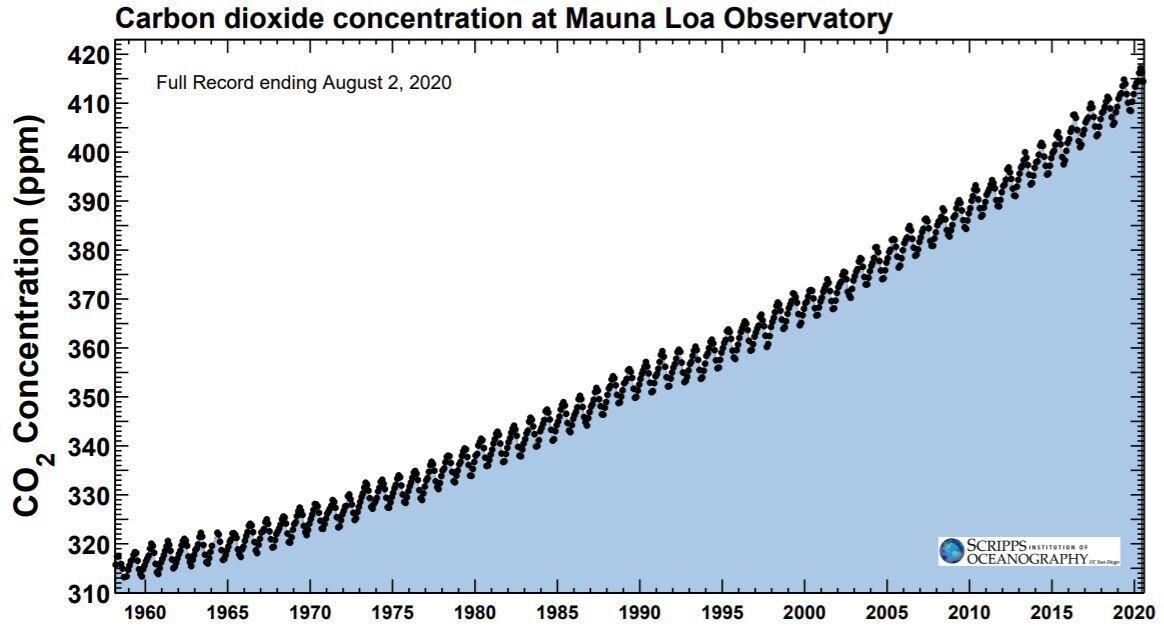
Courtesy of the Scripps Institution of Oceanography (SIO). scripps.ucsd.edu/programs/keelingcurve/pdf-downloads/
CO2 levels are rising. In 2013 they passed the level of 400 parts per million (ppm) for the first time in human history, and this is causing a corresponding rise in global temperatures. Whilst the historical correlation of CO2 to temperature is clear (see how closely the two blue lines in the NOAA figure below follow each other) a key question that climatologists have considered is “does an increase in CO2 cause an increase in temperature?”. This “causality” is crucial, and the scientific conclusion that CO2 emissions are the main driving force behind global temperature increases is supported by the overwhelming majority of scientific authorities (including the IPCC, NASA, NOAA, EPA, UK Met Office and nearly 200 scientific organisations worldwide including the national academies of each nation in the G8) - we will discuss the extraordinary strength of this scientific consensus in a future blog.

Temperature change (light blue) and carbon dioxide change (dark blue) measured from the EPICA Dome C ice core in Antarctica (Jouzel et al. 2007; Lüthi et al. 2008). https://www.ncdc.noaa.gov/global-warming/temperature-change
How much has the temperature risen already?
The global average temperature has risen by 1°C since pre-industrial times. This may not sound like a lot, but it is a global average, and the rate of the temperature increase is startling compared to historical shifts. It is worth noting this global temperature is not based on a single measurement, but the conclusion of various land and ocean field measurements across the globe.

What effect has climate change already had?
The climate has already changed and the impacts are already being felt.
The global temperature increase of 1°C has had a measurable impact on our climate, and it has upset the delicate balance of self-regulating feedback loops that keep our weather patterns and natural systems in check (we will cover feedback loops in a future blog).
The knock-on effects of this temperature increase are numerous, and the Intergovernmental Panel on Climate Change (IPCC) list many of them in their AR5 2014 Impacts, Adaption & Vulnerability report:
Changing precipitation or melting snow and ice are altering hydrological systems, affecting water resources in terms of quantity and quality;
Impacts from recent climate-related extremes, such as heat waves, droughts, floods, cyclones, and wildfires, reveal significant vulnerability and exposure of some ecosystems and many human systems to current climate variability;
Based on many studies covering a wide range of regions and crops, negative impacts of climate change on crop yields have been more common than positive impacts;
Many terrestrial, freshwater, and marine species have shifted their geographic ranges, seasonal activities, migration patterns, abundances, and species interactions in response to ongoing climate change;
Differences in vulnerability and exposure arise from non-climatic factors and from multidimensional inequalities often produced by uneven development processes;
Climate-related hazards exacerbate other stresses, often with negative outcomes for livelihoods, especially for people living in poverty.
A map of these impact areas was published by the IPCC in the report and is shown below:

IPCC Report AR4 Figure 2: (A) Global patterns of impacts in recent decades attributed to climate change, based on studies since the AR4. https://www.ipcc.ch/site/assets/uploads/2018/02/ar5_wgII_spm_en.pdf
To take some real-world examples:
The recent wildfires in Australia were found to be made 30% more likely because of anthropogenic climate change.
A report by the United States Global Change Research Program in 2018 found that the US heatwave season has expanded by 40 days since 1960 and that climate change is directly responsible for a doubling of the wildfires in the Western USA since 1984. As this blog is being written the Western USA is experiencing devastating forest fires.
The level of the sea has risen, and is rising increasingly fast, at a rate of 1/8 of an inch a year. Even changes on this scale can be significant locally, for example in combination with storm surges and hurricanes.
Many species are finding it harder to survive in the wild due to changing weather patterns, the plight of the polar bear being perhaps the most well known, but climate change has actually claimed its first extinction victim – a rodent on the barrier reef wiped out due to increasingly high storm surges.
Over the last two decades, the IPCC has concluded that the Greenland and Antarctic ice sheets have been losing mass, glaciers have continued to shrink almost worldwide, and Arctic sea ice and Northern Hemisphere spring snow cover have continued to decrease in extent, with some signs that this is occurring at unexpectedly rapid rates.
In the oceans, mass coral reef “bleaching” events are becoming more frequent due to warmer waters, and the pH of surface ocean waters has fallen by 0.1 pH units. Because of the logarithmic scale of pH, this actually represents a roughly 30 percent increase in acidity, and this in turn is causing measurable stress to species with shells such as molluscs and plankton (see our recent blog on Climate Change and Protecting the Oceans).
Further increases in temperature will exacerbate these problems even more and could even tip some of the natural self-regulating systems in the earths climate past a point of no return. In future blogs in this series we will investigate how the climate regulates itself via feedback loops, examine tipping points, and look at climate models and predictions.
This blog contains numerous sources that can be investigated to further understand climate change, but some of the most useful and reputable sources of the latest climate science can be found below:
Future blogs in this series will look at how our climate corrects itself via feedback loops, we will also give a brief history of our climate to put today’s trends in context, examine possible future scenarios and explain the key concept of scientific consensus.